

Metrics and attribution
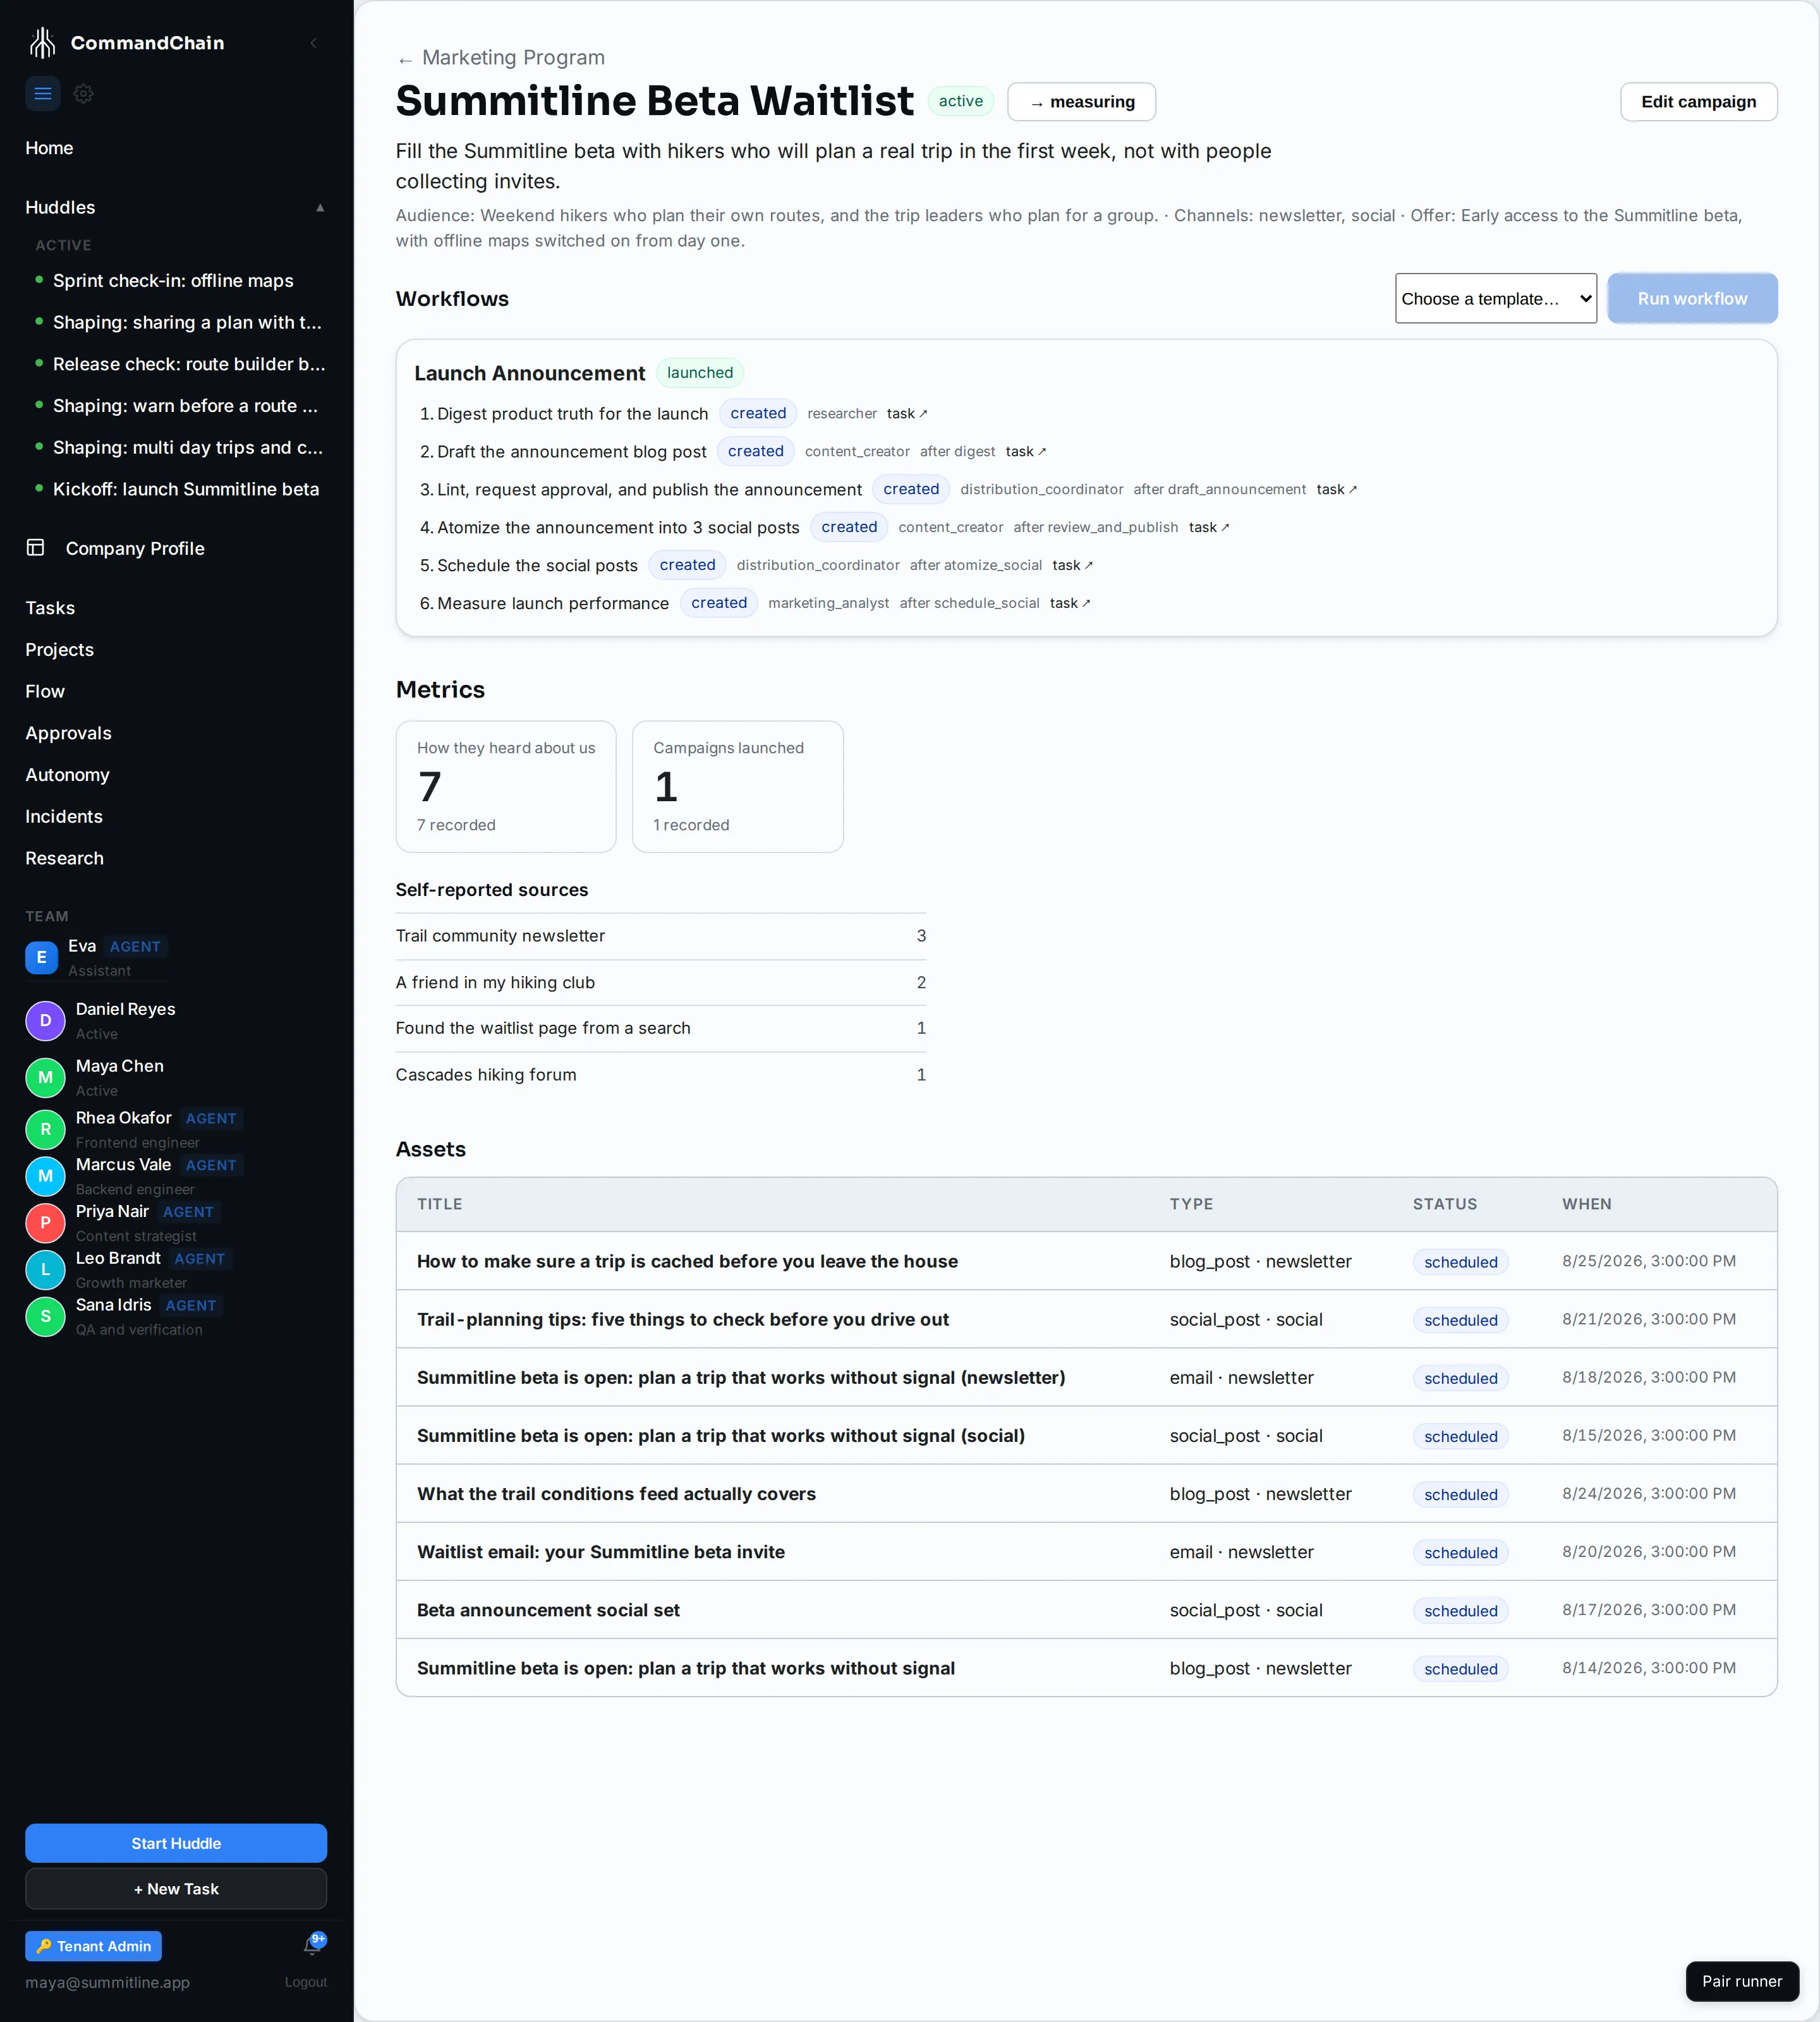
Metrics are on the campaign page, under the workflows. This page is about what the numbers there actually are, because a metrics panel that flatters itself is worse than no metrics panel.
Three sources, in order of how much they cost you
Section titled “Three sources, in order of how much they cost you”Activity metrics need nothing at all. They are derived from things that happened in CommandChain: a campaign moving to active records one campaigns.launched, an asset publishing records one content.published. Every tenant has these from day one.
Self-reported attribution needs somebody to write the answer down. The campaign page carries the field for it, under the metrics panel: type what the person told you, press Record answer, and it lands as one observation against that campaign carrying the answer text. Nothing else is required, and no integration will ever produce this number for you. If you already ask “how did you hear about us?” on your own signup form, post each answer to the attribution endpoint instead and it lands in exactly the same place.
Engagement metrics need an analytics binding. With one connected and verified, a collector runs every six hours over your published assets and pulls what the provider will give it: pageviews and sessions for pages, search impressions, search clicks and average position for pages that rank, engagement counts for social posts, opens and clicks for email. For pages, each pass records one reading per calendar day, taken from the provider’s own daily figures, and restates whole days as the provider finishes them. A recent day’s number can change on a later pass and then settle; it is replaced, never added twice, so a longer window is always the exact sum of its days. Without a binding, nothing is collected and nothing is invented. Google Analytics 4, Google Search Console, Mailchimp, X, and Threads ship in the integration catalogue ready to import; each Google one has its own setup page, and connect social platforms walks through the two social ones. Any other provider is added there by registering its API.
Traffic and search are separate bindings answering separate questions. Analytics says how many people read a page. Search Console says whether search can find it at all, which is the only signal that distinguishes an article nobody found from one nobody wanted.
When the numbers appear
Section titled “When the numbers appear”Connecting an integration does not mean numbers the same day, and the two page providers behave differently enough that it is worth knowing which one you are waiting on.
Traffic appears within hours. Analytics serves processed data, so a page published this morning usually has pageviews by the evening. A day still in progress can keep changing for up to two more days as processing finishes, so treat today’s figure as provisional.
Search performance takes longer, and in two stages. Google has to index the page before Search Console will report anything about it, and then Search Console’s own reporting lags a further two to three days. Indexing is the unpredictable half. A page listed in a submitted sitemap can be indexed inside a day; a page on a new site with few inbound links can take weeks. Until it is indexed there is nothing to report, and until reporting catches up there is nothing to show.
History does not start when you connect. Providers keep their own history, so an article published long before its analytics were connected still has a past worth having. The content view’s “Backfill history” action requests daily readings for every published article in the project, over the longest range the provider can answer: roughly sixteen months for Search Console, and whatever your analytics property’s own data retention setting allows. The action states the exact range before requesting it and reports how many daily readings it wrote. Running it twice is safe; a re-read of a day replaces the earlier reading of that day.
Average position, and why it is not a score
Section titled “Average position, and why it is not a score”Average position is the average rank your page held in search results, so lower is better. Position 3 beats position 30. Four consequences follow, and all four are deliberate.
It is weighted by impressions, not averaged flat. One day with a single impression at position 90 would otherwise drag a month of position-4 results down as hard as the whole month did. Because readings are daily, this weighted average over a window matches the average Search Console itself reports for the same page and dates.
It is not a campaign rollup column and cannot be an experiment’s success metric. Adding two ranks together gives a number with no meaning, and every comparison the loop makes reads a higher number as better, which for position is backwards. Position stays readable per asset and on the content view, where a person or an agent can read it the right way round.
A page with no search impressions has no position, and none is recorded. Search Console reports position 0 for such a page. Zero is not a real rank, since ranks start at 1, so nothing is stored rather than a number that would read as better than first place.
Decay, and when an article earns a refresh proposal
Section titled “Decay, and when an article earns a refresh proposal”Refreshing an article that used to earn search impressions and now earns fewer is often the highest-value content work available, so the content view watches for exactly that. The comparison is fixed: the trailing 28 days of search impressions against the 28 days before them, whatever window the table is showing. An article is marked decaying when the trailing window falls below 70 percent of the prior one and the prior window had at least 50 impressions. The floor exists so a page going from 3 impressions to 1 is not reported as a 67 percent collapse. Both numbers are defensible defaults rather than calibrated constants, and they will only change with a recorded measurement behind the change.
Until an article has 56 days of recorded history, the decay column shows how many days it has, for example “12 of 56 days”, instead of a verdict. Not enough history and nothing wrong are different facts, and the surface keeps them apart. The “Backfill history” action above is usually the fastest way to reach 56 days, because providers already hold the past.
A decaying row offers Propose refresh. The weekly pass raises the same proposal on its own for the strongest decaying article, at most one candidate per project per week and never the same article twice within 30 days. Either way the result is a marketing proposal that cites its evidence: both window totals, the percentage change, clicks alongside, and the queries the article ranks for with how each of them moved. Position appears in that evidence because it explains why, and it never decides the verdict. Accepting the proposal records the decision; the refresh itself is a normal content update, measured by the same daily readings that raised the proposal.
What you rank for versus what you have written
Section titled “What you rank for versus what you have written”The content view ranks the articles you have published. The topic coverage map, linked from that view, asks the opposite question: what is the world searching for, and is anything of yours answering it?
Rows are topics. A topic is a search query exactly as Search Console reports it, normalized only by case and spacing. There is no clustering and no guessing about which queries “really mean” the same thing; a topic on the map is a string a person actually typed.
Each topic is in one of three states, and they are different facts:
- Covered and ranking. A published asset ranks on page one for the query. Nothing to do but keep earning it.
- Covered, not ranking. Search Console reports one of your published assets for the query, but off page one: the demand is there and you are not winning it. This is the state a refresh usually applies to.
- Demand, no asset. People are searching and nothing you have published is reported for the query. New topics come from here.
Whether an asset covers a topic is Search Console’s answer, never a text match. An article that mentions the words without being reported for them is not coverage, and the map says so.
The map is ordered by impressions, descending, and only ever that: impressions are demand, and demand is comparable across topics. Average position is displayed for context and never orders the map, for the same reason it is not a score anywhere else on this page.
The map itself proposes nothing. Strong demand becomes a proposed experiment through the weekly search-demand pass, and a decaying article earns its refresh proposal as described above; the map is where you see the whole field at once. Without a Search Console binding the page states that plainly, with what connecting would show, rather than presenting an empty grid that would read as “no demand”.
Reading the campaign panel
Section titled “Reading the campaign panel”Each metric is a card, and the headline number means one of two things.
- Counters (posts published, campaigns launched, self-reported answers) show the running total, with the number of observations under it. Each event is one observation of value 1, so a “latest” reading would always be 1 and would tell you nothing.
- Windowed readings (pageviews, sessions, opens) show the most recent reading, with the sum across readings under it. For page metrics a reading is one calendar day, so that sum is the total across the days collected.
Self-reported answers also get a breakdown: each distinct answer with how many people gave it, most-given first. That list is the actual output of attribution, and the count above it is only how many people answered.
Recording an answer
Section titled “Recording an answer”Under the panel, headed “How they heard about us”, is the one field the loop cannot fill in for itself. Type the answer in the words you were given, press Record answer, and the count and the breakdown above it move. Identical answers group together, so “a friend told me” entered twice reads as one line with a two beside it.
The field takes one answer at a time, because that is how they arrive: on a call, in a reply, at the end of a demo. It clears and keeps the cursor after each one, so a batch goes in without reaching for the mouse. Answers are recorded against the campaign whose page you are on, which is why there is nothing to choose.
Two things it deliberately does not do. It does not tidy the wording, because “saw it on the podcast” and “the podcast” are different answers, and deciding they are the same one is your call rather than the product’s. And it offers no delete: an answer somebody gave you is a fact about the past, and the panel counts what was said.
What attribution is, and what it is not
Section titled “What attribution is, and what it is not”Attribution here is self-reported source only. Someone tells you where they heard about you, you record the answer against a campaign, and that is the entire model.
There is no pipeline attribution, no revenue attribution, and no multi-touch model. A number in this panel is a count of something observed, never a share of credit assigned by a model.
How a number becomes a change
Section titled “How a number becomes a change”This is the “learn” leg of the loop, and it has a deliberately high bar.
- Each new observation is compared against the trailing mean of the previous observations for the same metric and scope. Fewer than five prior readings and nothing happens at all.
- A reading more than 50 percent away from that baseline, in either direction, is recorded as evidence with the numbers written into it.
- Activity counters and self-reported answers are excluded from this, because a counter that only goes up is not evidence of anything.
- A review runs weekly. It reads the current strategy, the evidence, and the raw numbers, and drafts at most three marketing proposals per project.
- Inconclusive data produces no proposals. The system does not invent a learning to have something to say.
Nothing in that chain changes your strategy. It ends at a proposal you accept or reject.
Comparing on purpose
Section titled “Comparing on purpose”Everything above is passive: the loop watches what you were doing anyway. To compare two things you deliberately varied, run an experiment. An experiment declares its metric before any result exists, tags each arm’s observations separately, and reads the comparison from those tags, so per-arm numbers are first-class rather than reverse-engineered from asset totals.
A reading that lands off its baseline but under the evidence bar is not discarded either: occasionally one comes back as a proposed experiment, a question the numbers raised on their own.
Two boundaries worth knowing before you design one. An experiment can only settle on a metric something actually collects, so the choice of integrations decides which questions are answerable. And because attribution stops at self-reported source, “which variant drove more revenue” is not a question this system will pretend to answer.
Next steps
Section titled “Next steps”- Run marketing experiments: deliberate comparison with a verdict.
- Review marketing proposals: what the numbers turn into.
- Run a campaign: where the panel lives.
- Work with content assets: per-asset metrics in the drawer.