

Follow the workflow and usage
Two places show what an agent is doing beyond its messages: the Workflow tab shows its plan and delegated work, and the usage chip shows how much context and account quota it has used. Both show only what the agent reports. Nothing is guessed.
Workflow
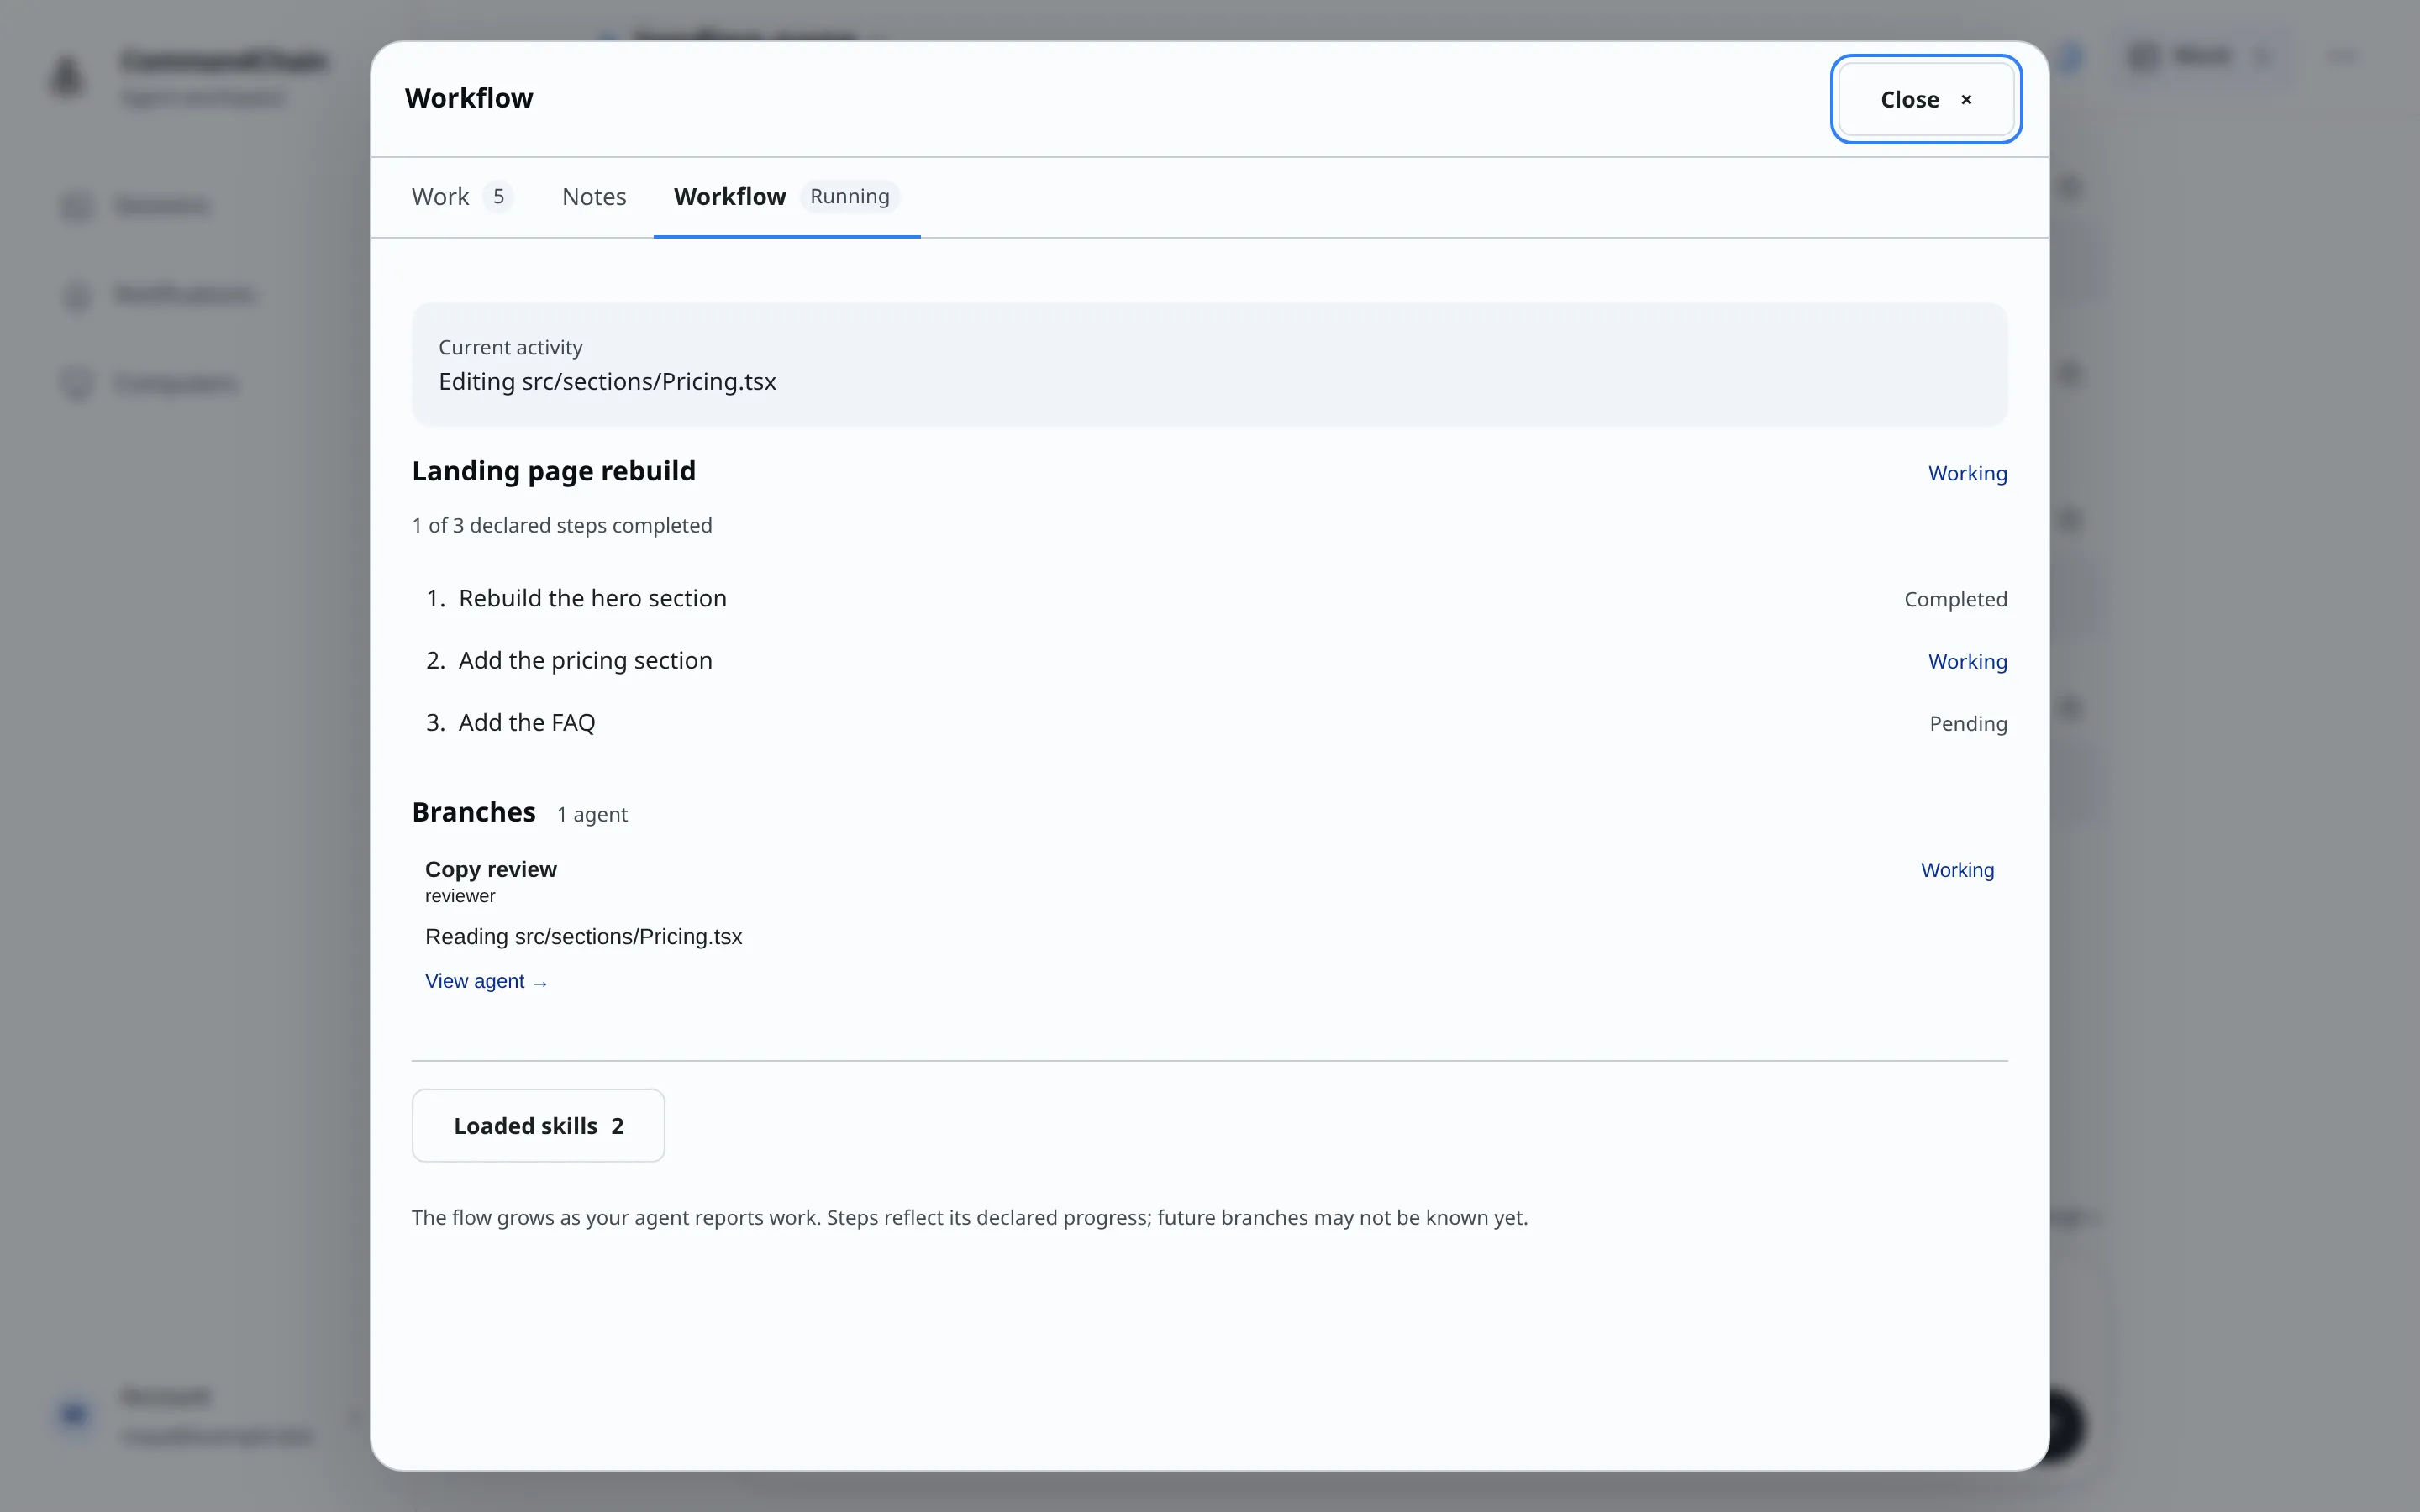
Section titled “Workflow”Select Work in the session header, then the Workflow tab. When the agent reports it, you see:
- Current activity: what the agent is doing right now.
- Declared steps: the steps of a plan the agent writes out for its work, such as a to-do list. For each plan you see a line such as “1 of 3 declared steps completed” and a status per step: Pending, Starting, Working, Waiting, Completed, Failed or Stopped. A step that waits on others says what it depends on.
- Branches: subagents the agent handed work to. A subagent is a helper agent that the main agent starts for one part of the job. For each one you see its role, its assigned task or latest update, and its status. Select a branch to read its updates. Branches a subagent delegated further sit under it.
- Loaded skills: the count of skills the agent loaded. Select it to see which ones.
The Workflow tab label carries a short status, such as Running, Waiting or Completed, so you can check progress without opening it.
If the agent hasn’t reported anything yet, you see Workflow is not available yet or No workflow reported yet, with Refresh session. The flow grows as the agent reports work, so later steps and branches may not be listed yet.
If the live connection drops, the tab shows “Live updates are unavailable. Showing the latest saved workflow.” Select Refresh session to check again.
When the agent reports usage, a chip appears in the session header next to Work:
- A small ring shows how full the context window is. It turns to a warning color at 80%. Hover over it to read “Context N% used”.
- If the agent reports tokens but not context, the chip shows the token count instead, or Usage and limits when it reports neither.
Select the chip to open Usage and limits.
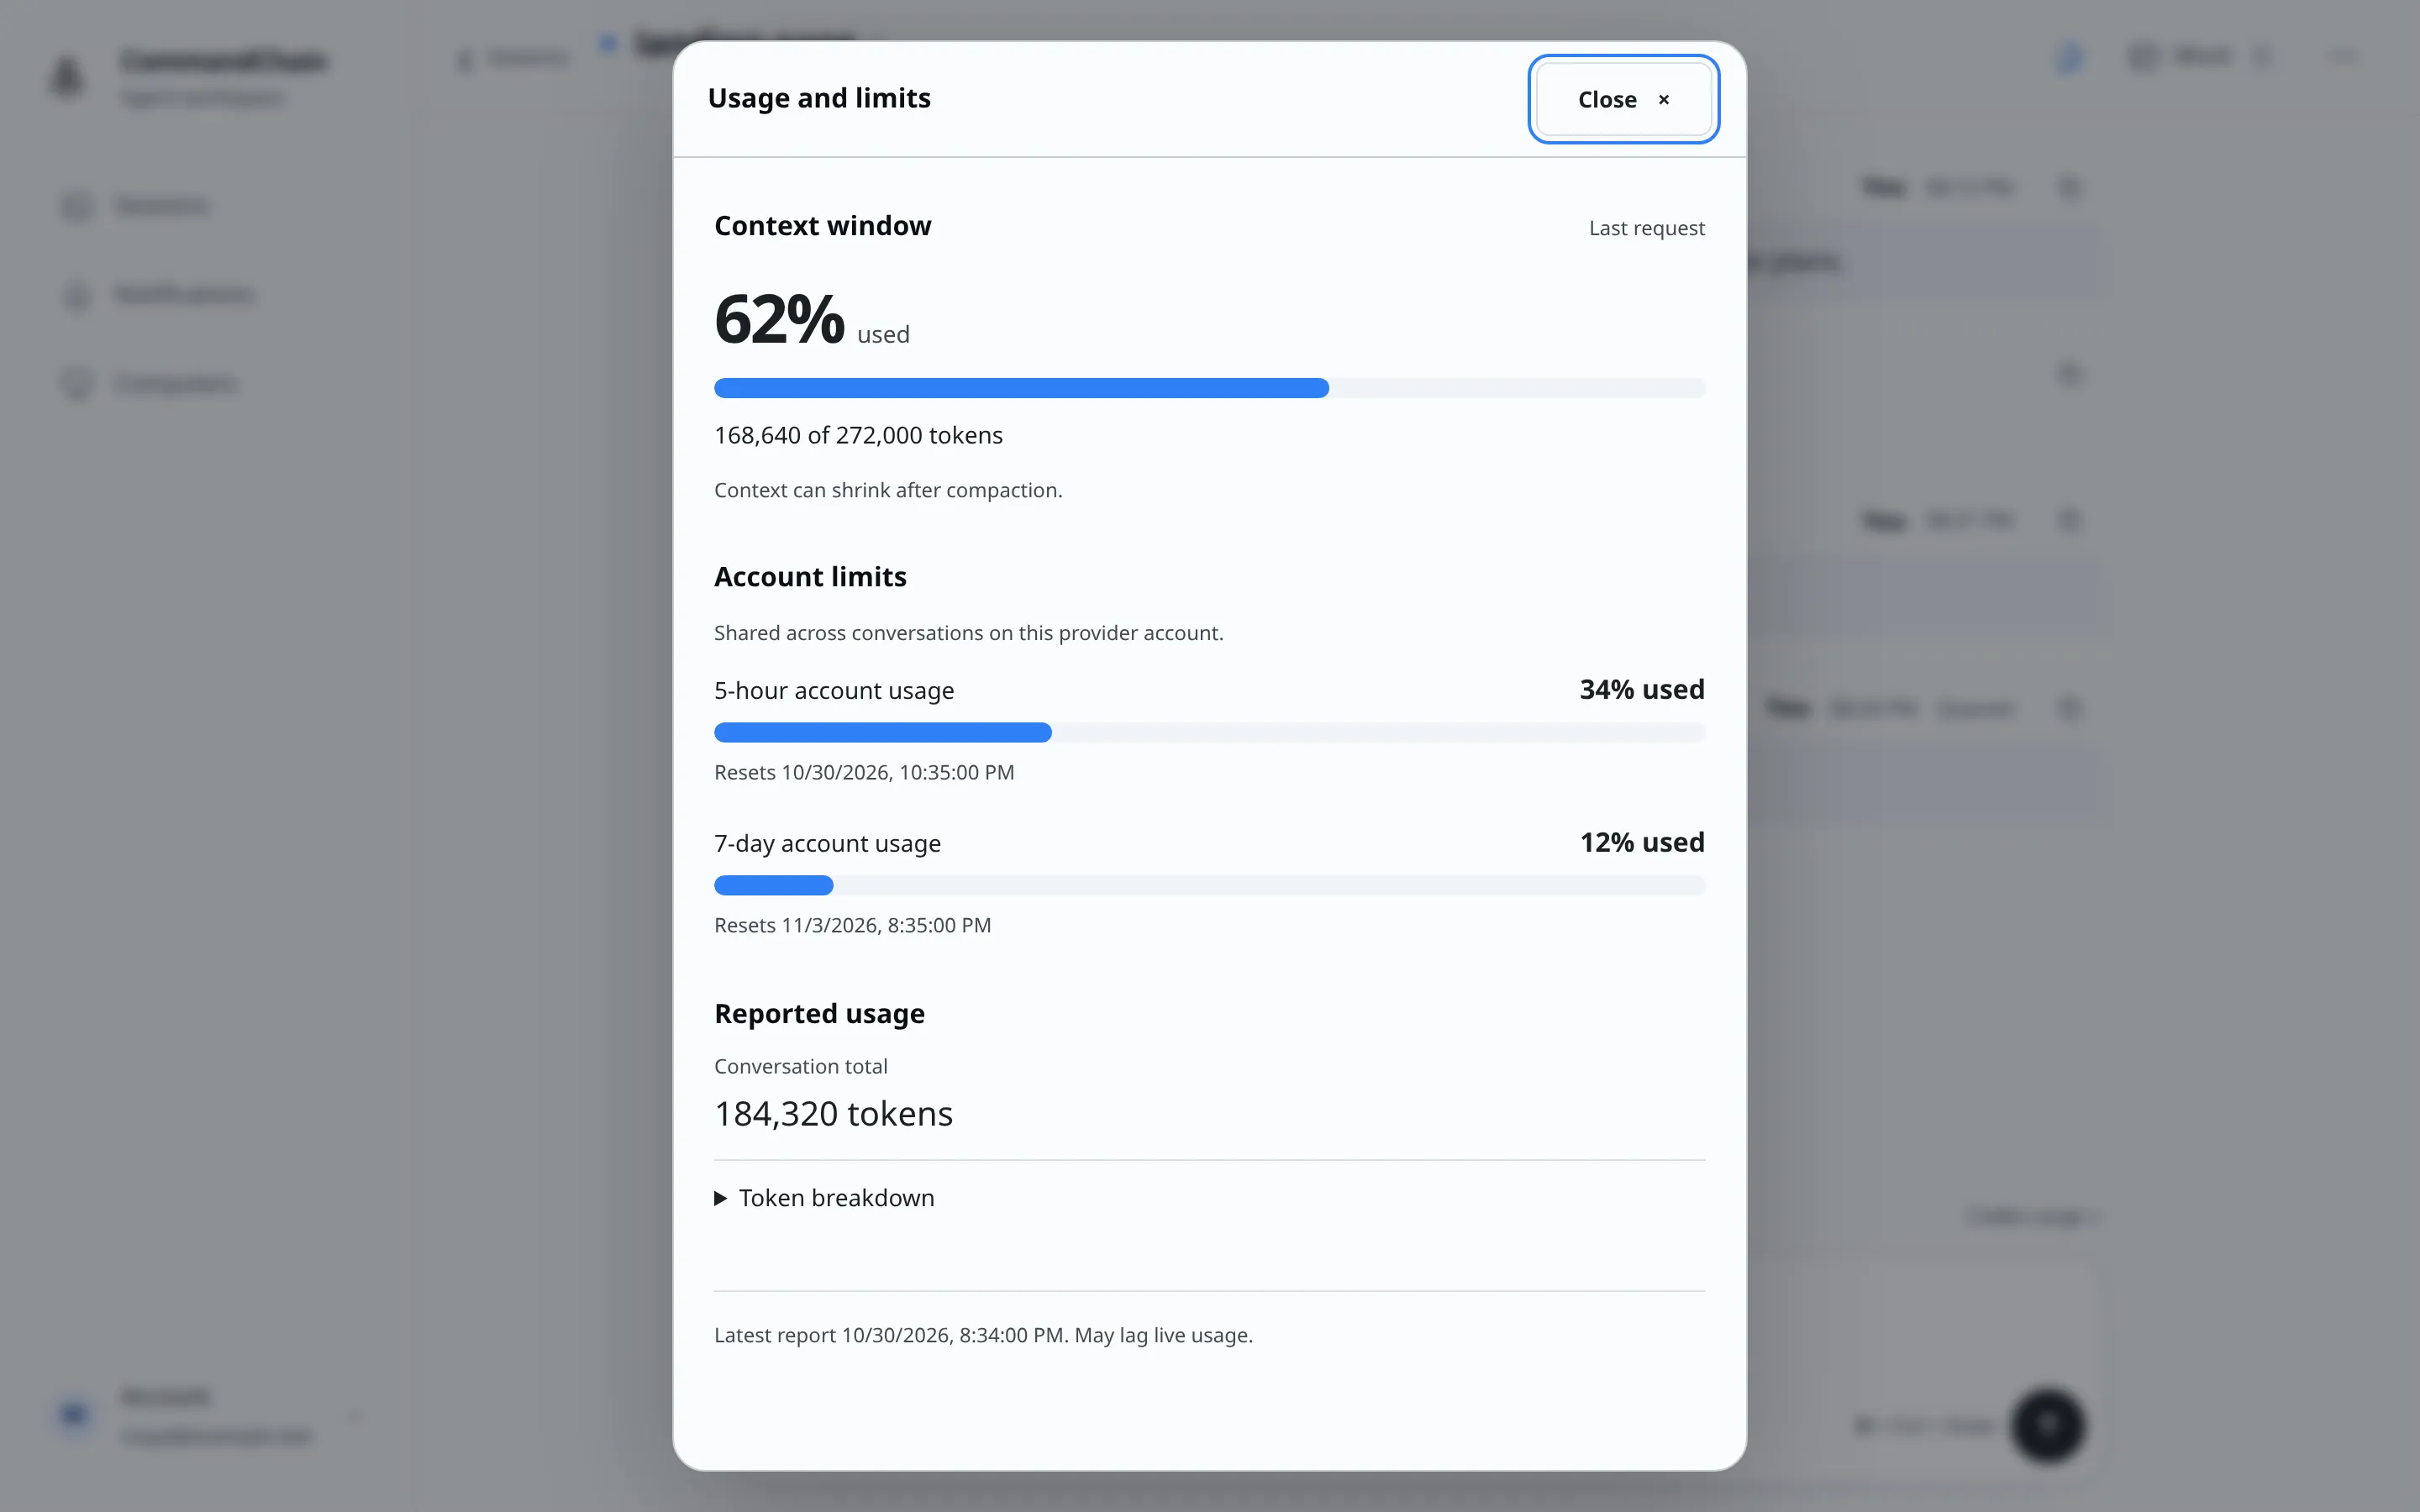
The panel has three sections:
- Context window: the percentage and the token count of the last request. The context window is how much conversation the model can hold at once. Context can shrink when the agent compacts it, which means summarizing earlier parts of the conversation to free up room.
- Account limits: one meter per usage window the provider reports, such as 5-hour account usage and 7-day account usage, each with its reset time. These limits are shared across every conversation on that provider account, not just this session.
- Reported usage: the total tokens and, when the agent reports it, the reported cost. Open Token breakdown for input, output, cached input (earlier input the provider reused instead of reading again), cache writes (input saved for reuse) and reasoning output (tokens the model spent thinking before it answered). These are the provider’s own numbers, not an estimate of what you’ll pay.
The panel ends with the time of the latest report, which can lag behind live usage. Anything the agent doesn’t report says so, for example “Account limits have not been reported.” Until the agent reports usage there is no chip in the header.