

Review artifacts and share previews
Choose Work in the session header to open the work sheet. It has three tabs: Work, Notes and Workflow. The Work button reopens whichever tab you used last, and its number counts the artifacts and previews in the session.
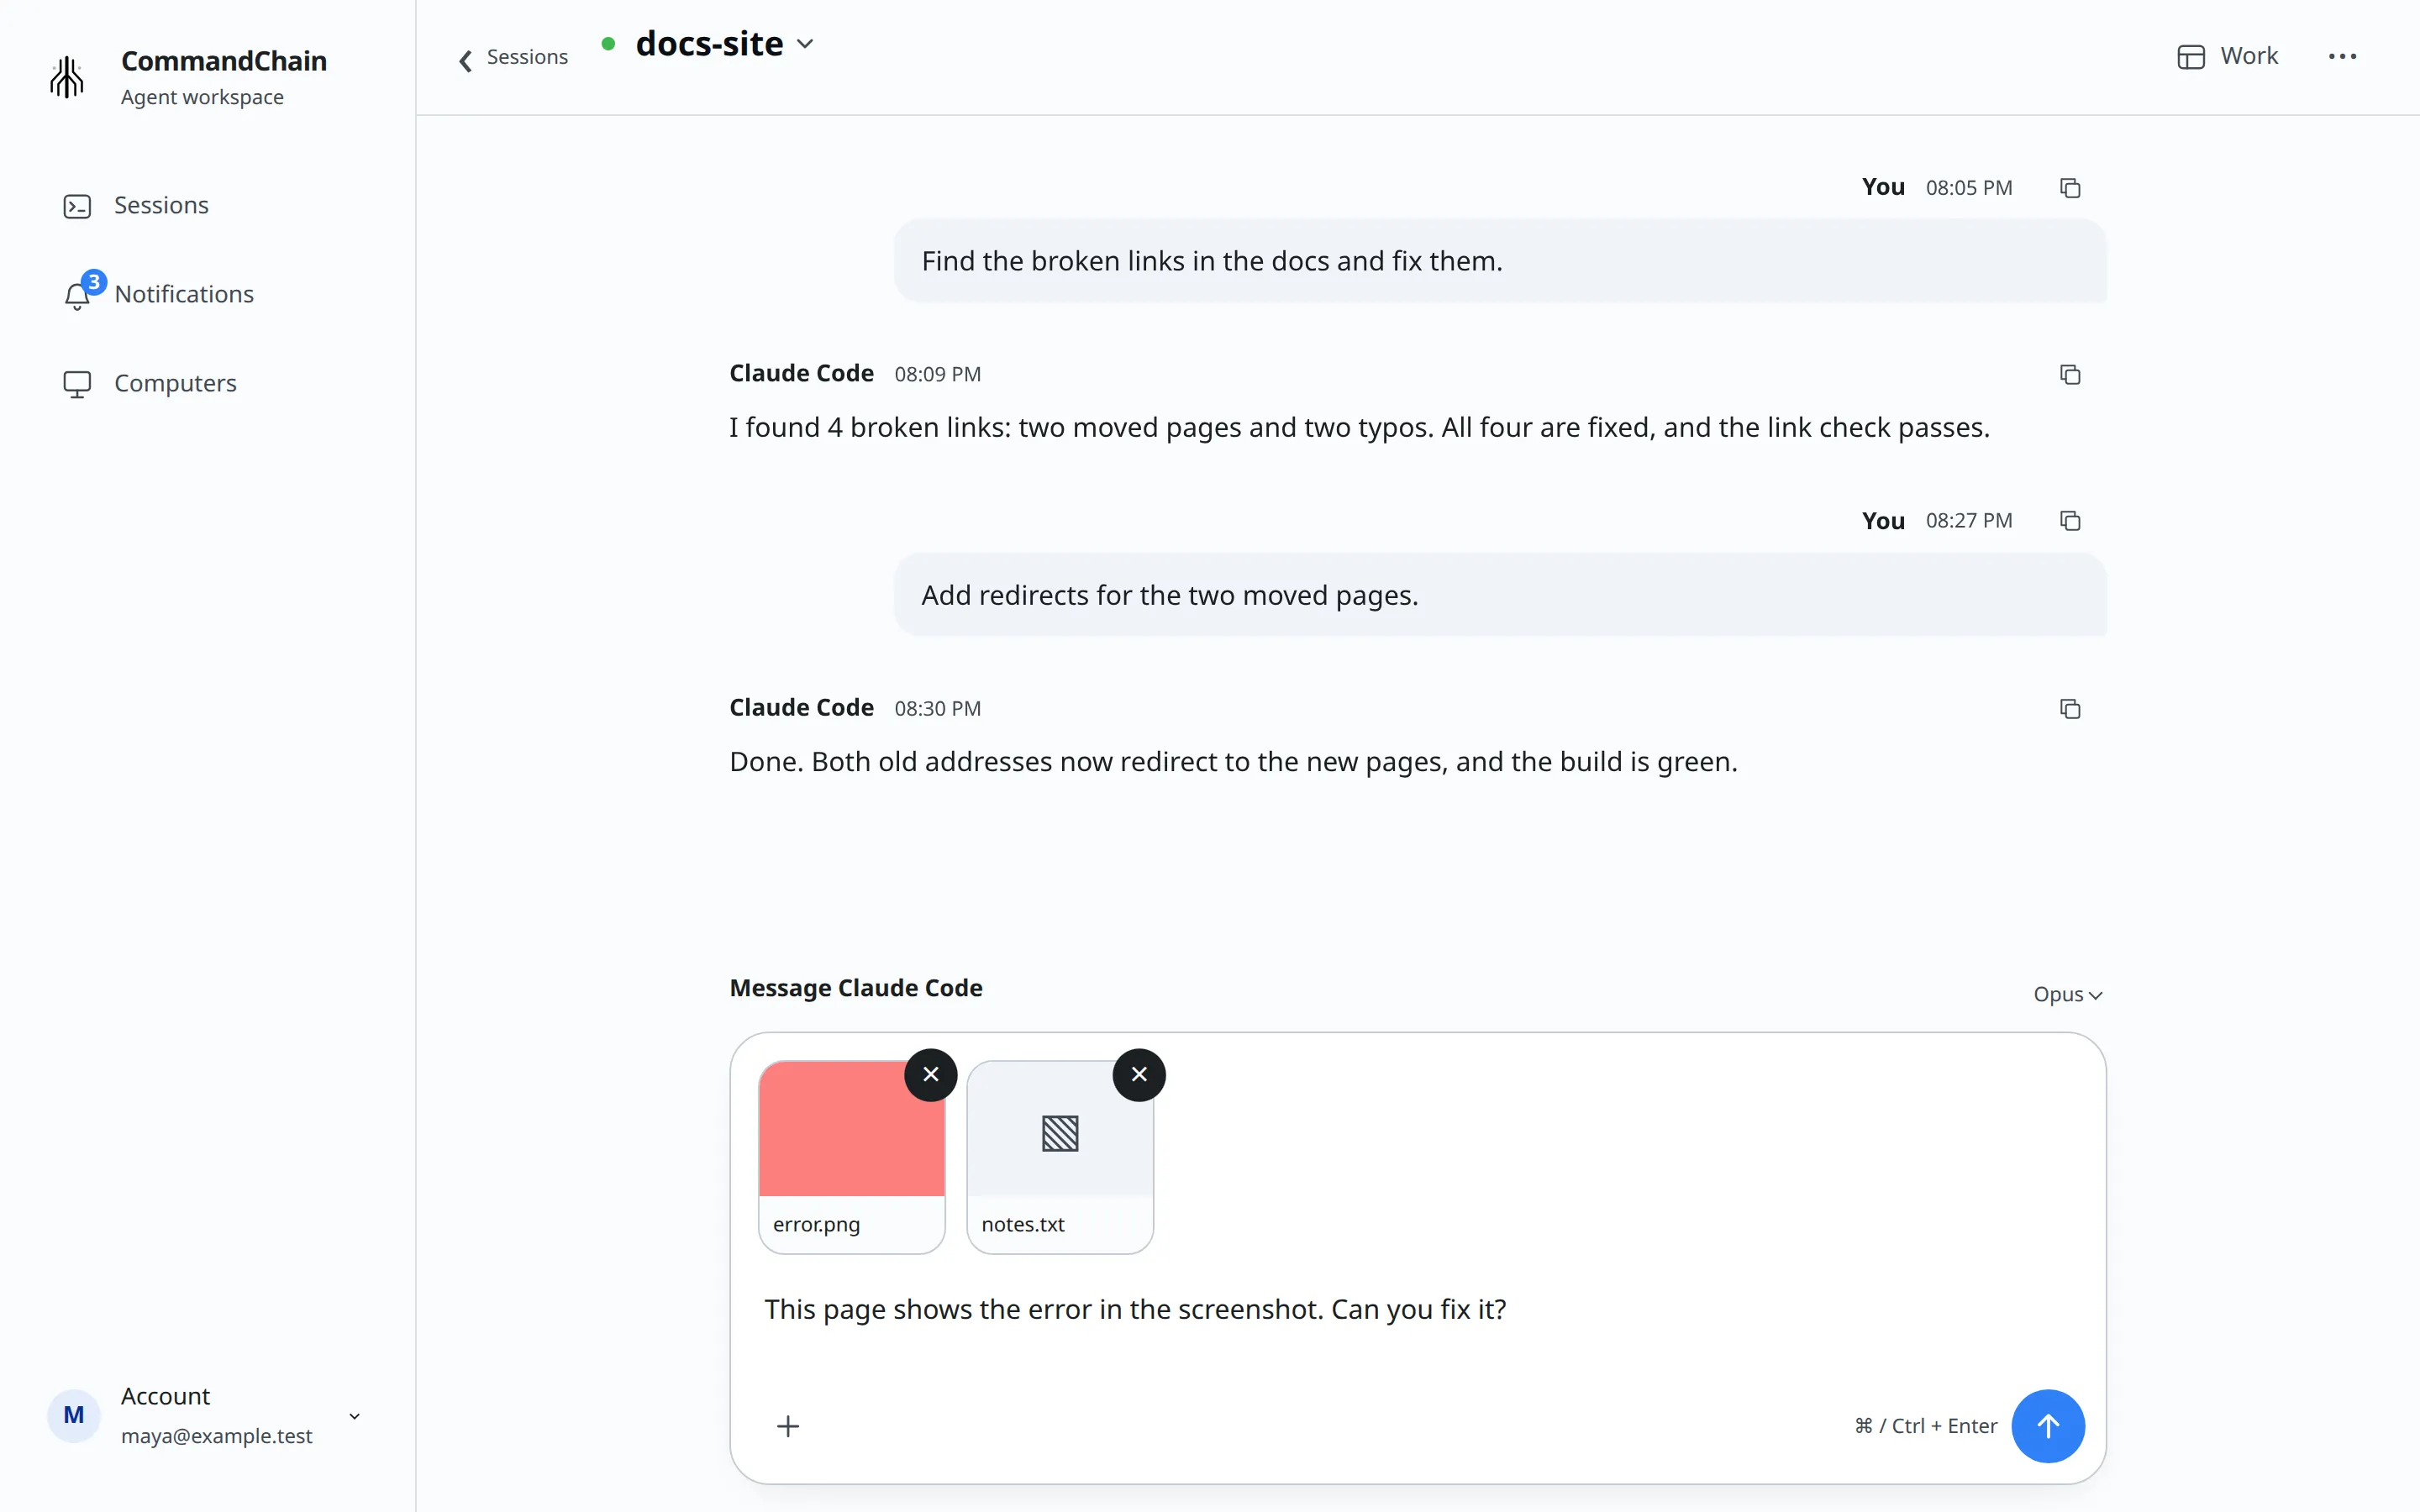
This page covers the Work tab. For the others, see Keep notes for a project and Follow the workflow and usage.
The Work tab has two parts: Artifacts and Previews & sharing.
Artifacts
Section titled “Artifacts”An artifact is something the agent publishes for you to look at while the conversation goes on. Six kinds show in the gallery:
- Page: a web page.
- Diagram: a rendered diagram.
- Table: a data table.
- Image: a picture.
- File: text shown inline, or an Open file button.
- Dashboard: a live view of the agent’s work, with status, charts and relevant artifacts.
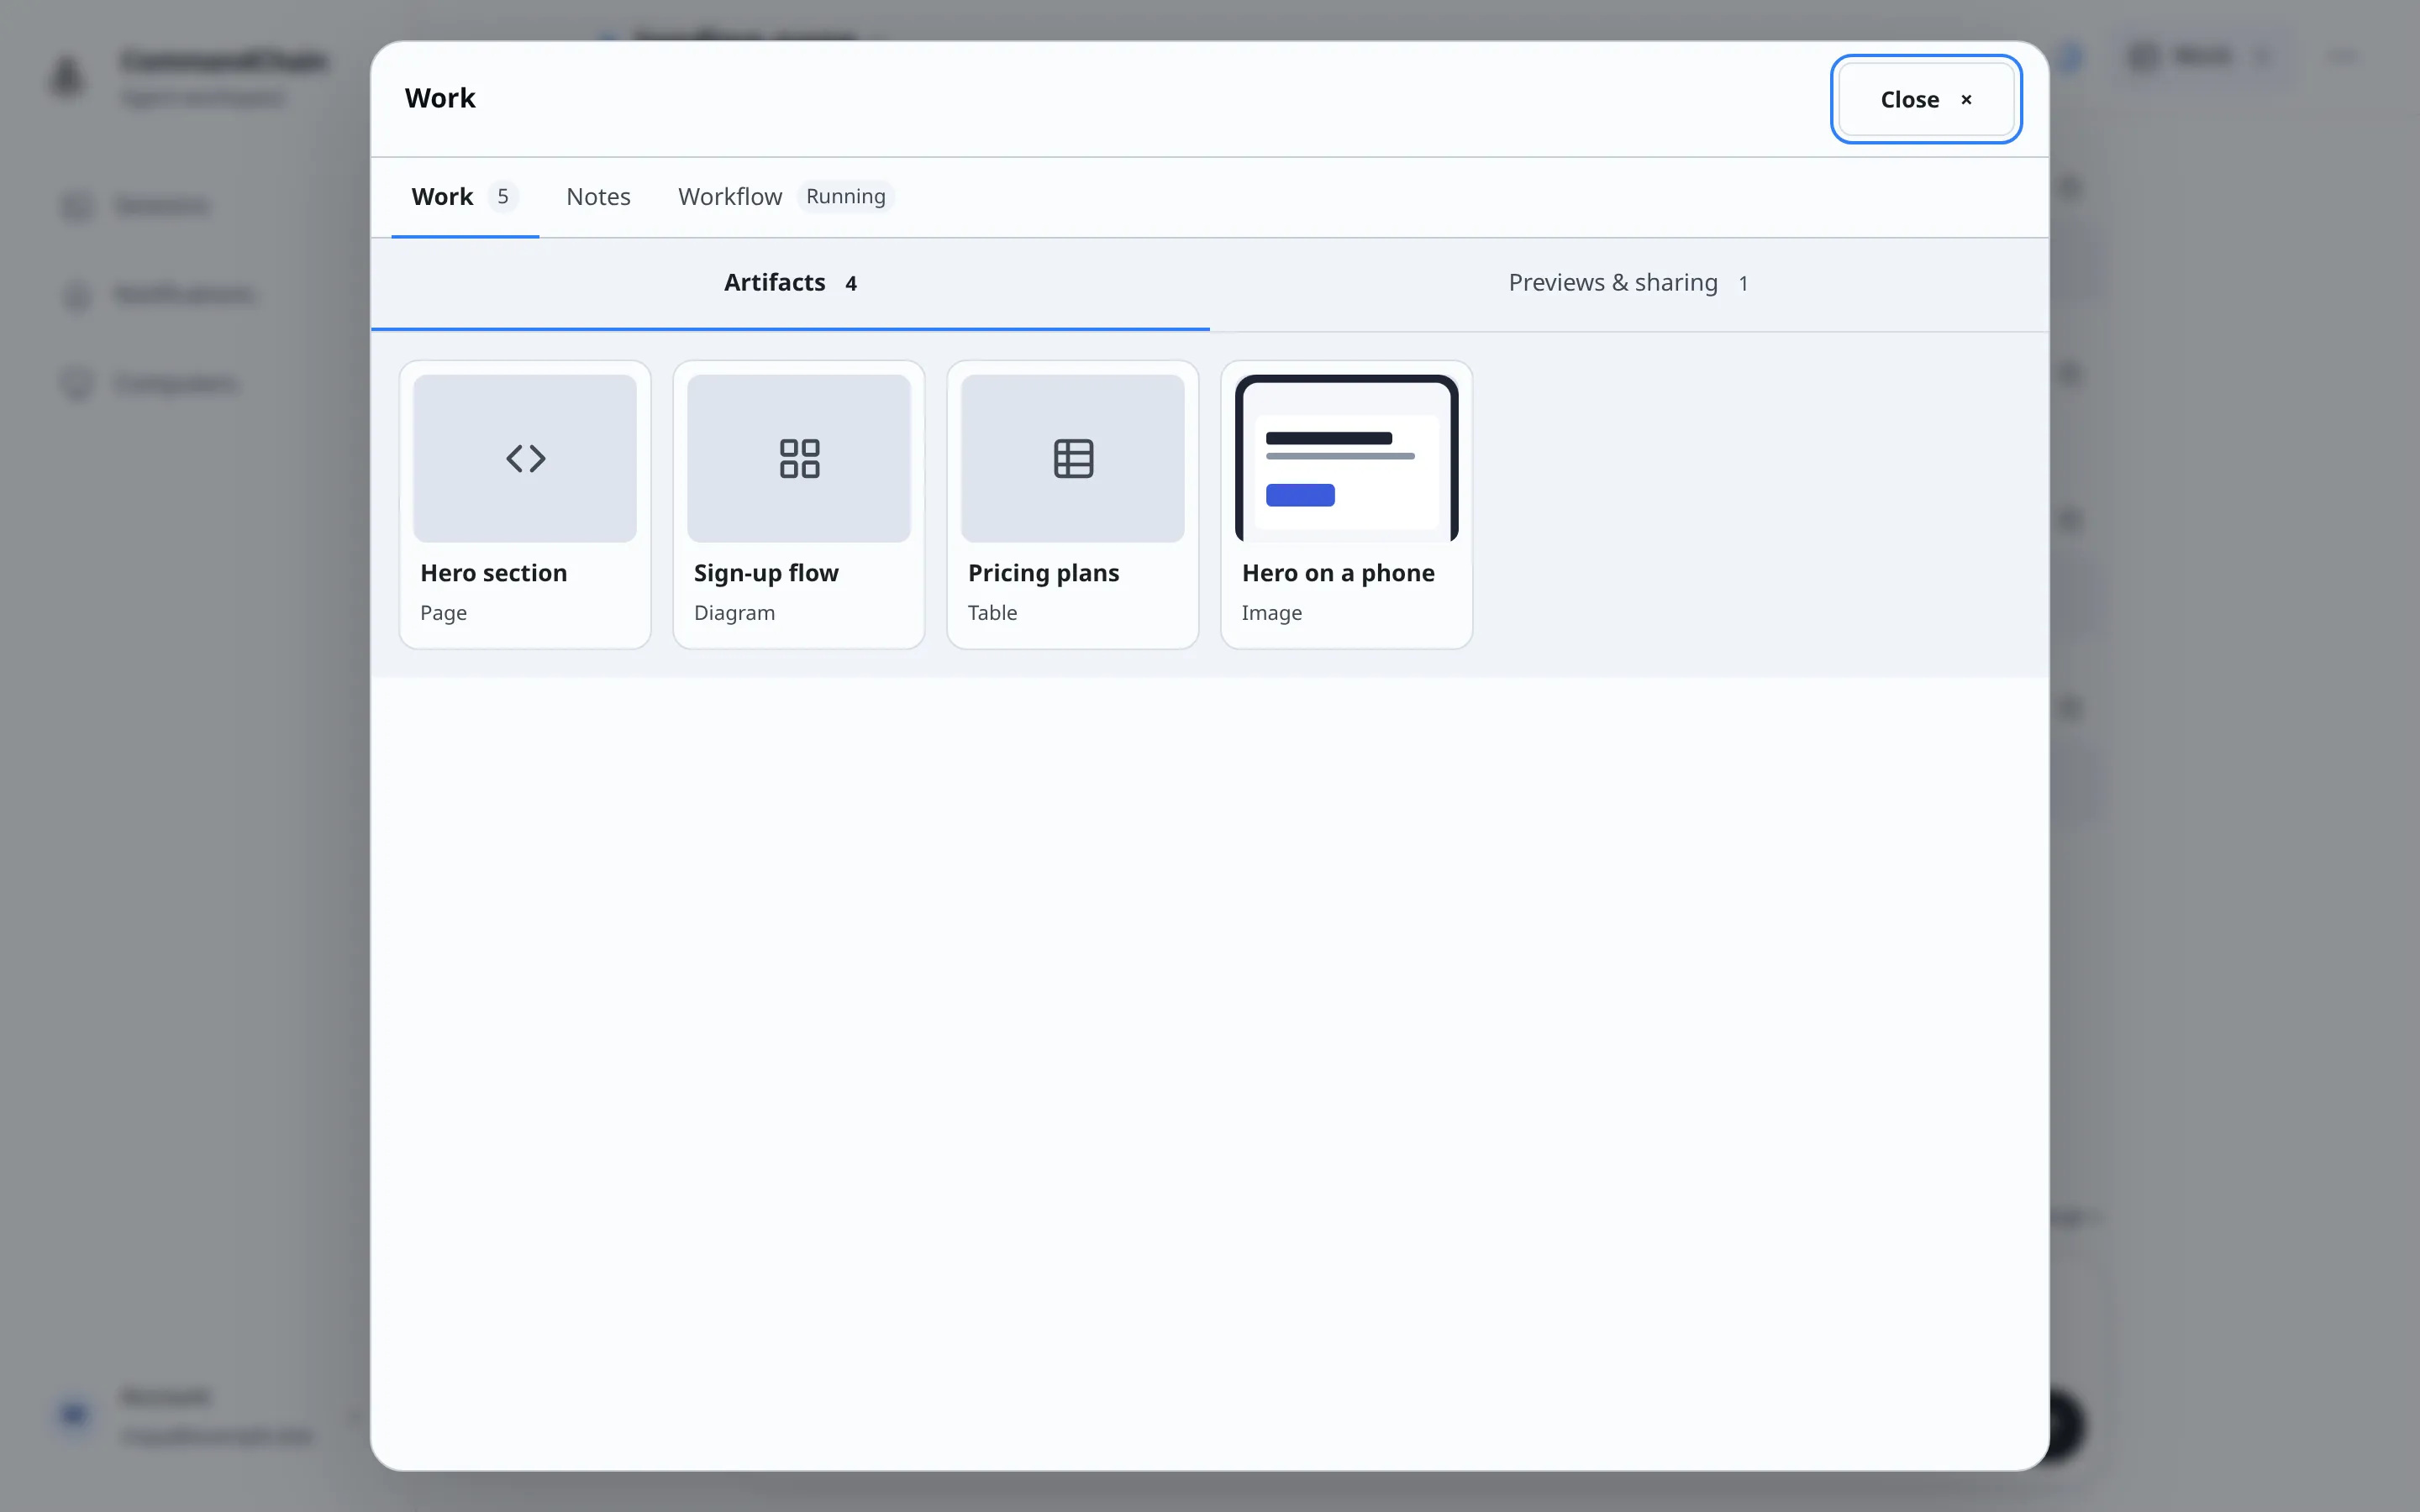
Choose a card to open the artifact. Use the arrows next to the count (3 of 4) to move to the previous or next one, or swipe on a phone. All artifacts takes you back to the gallery.
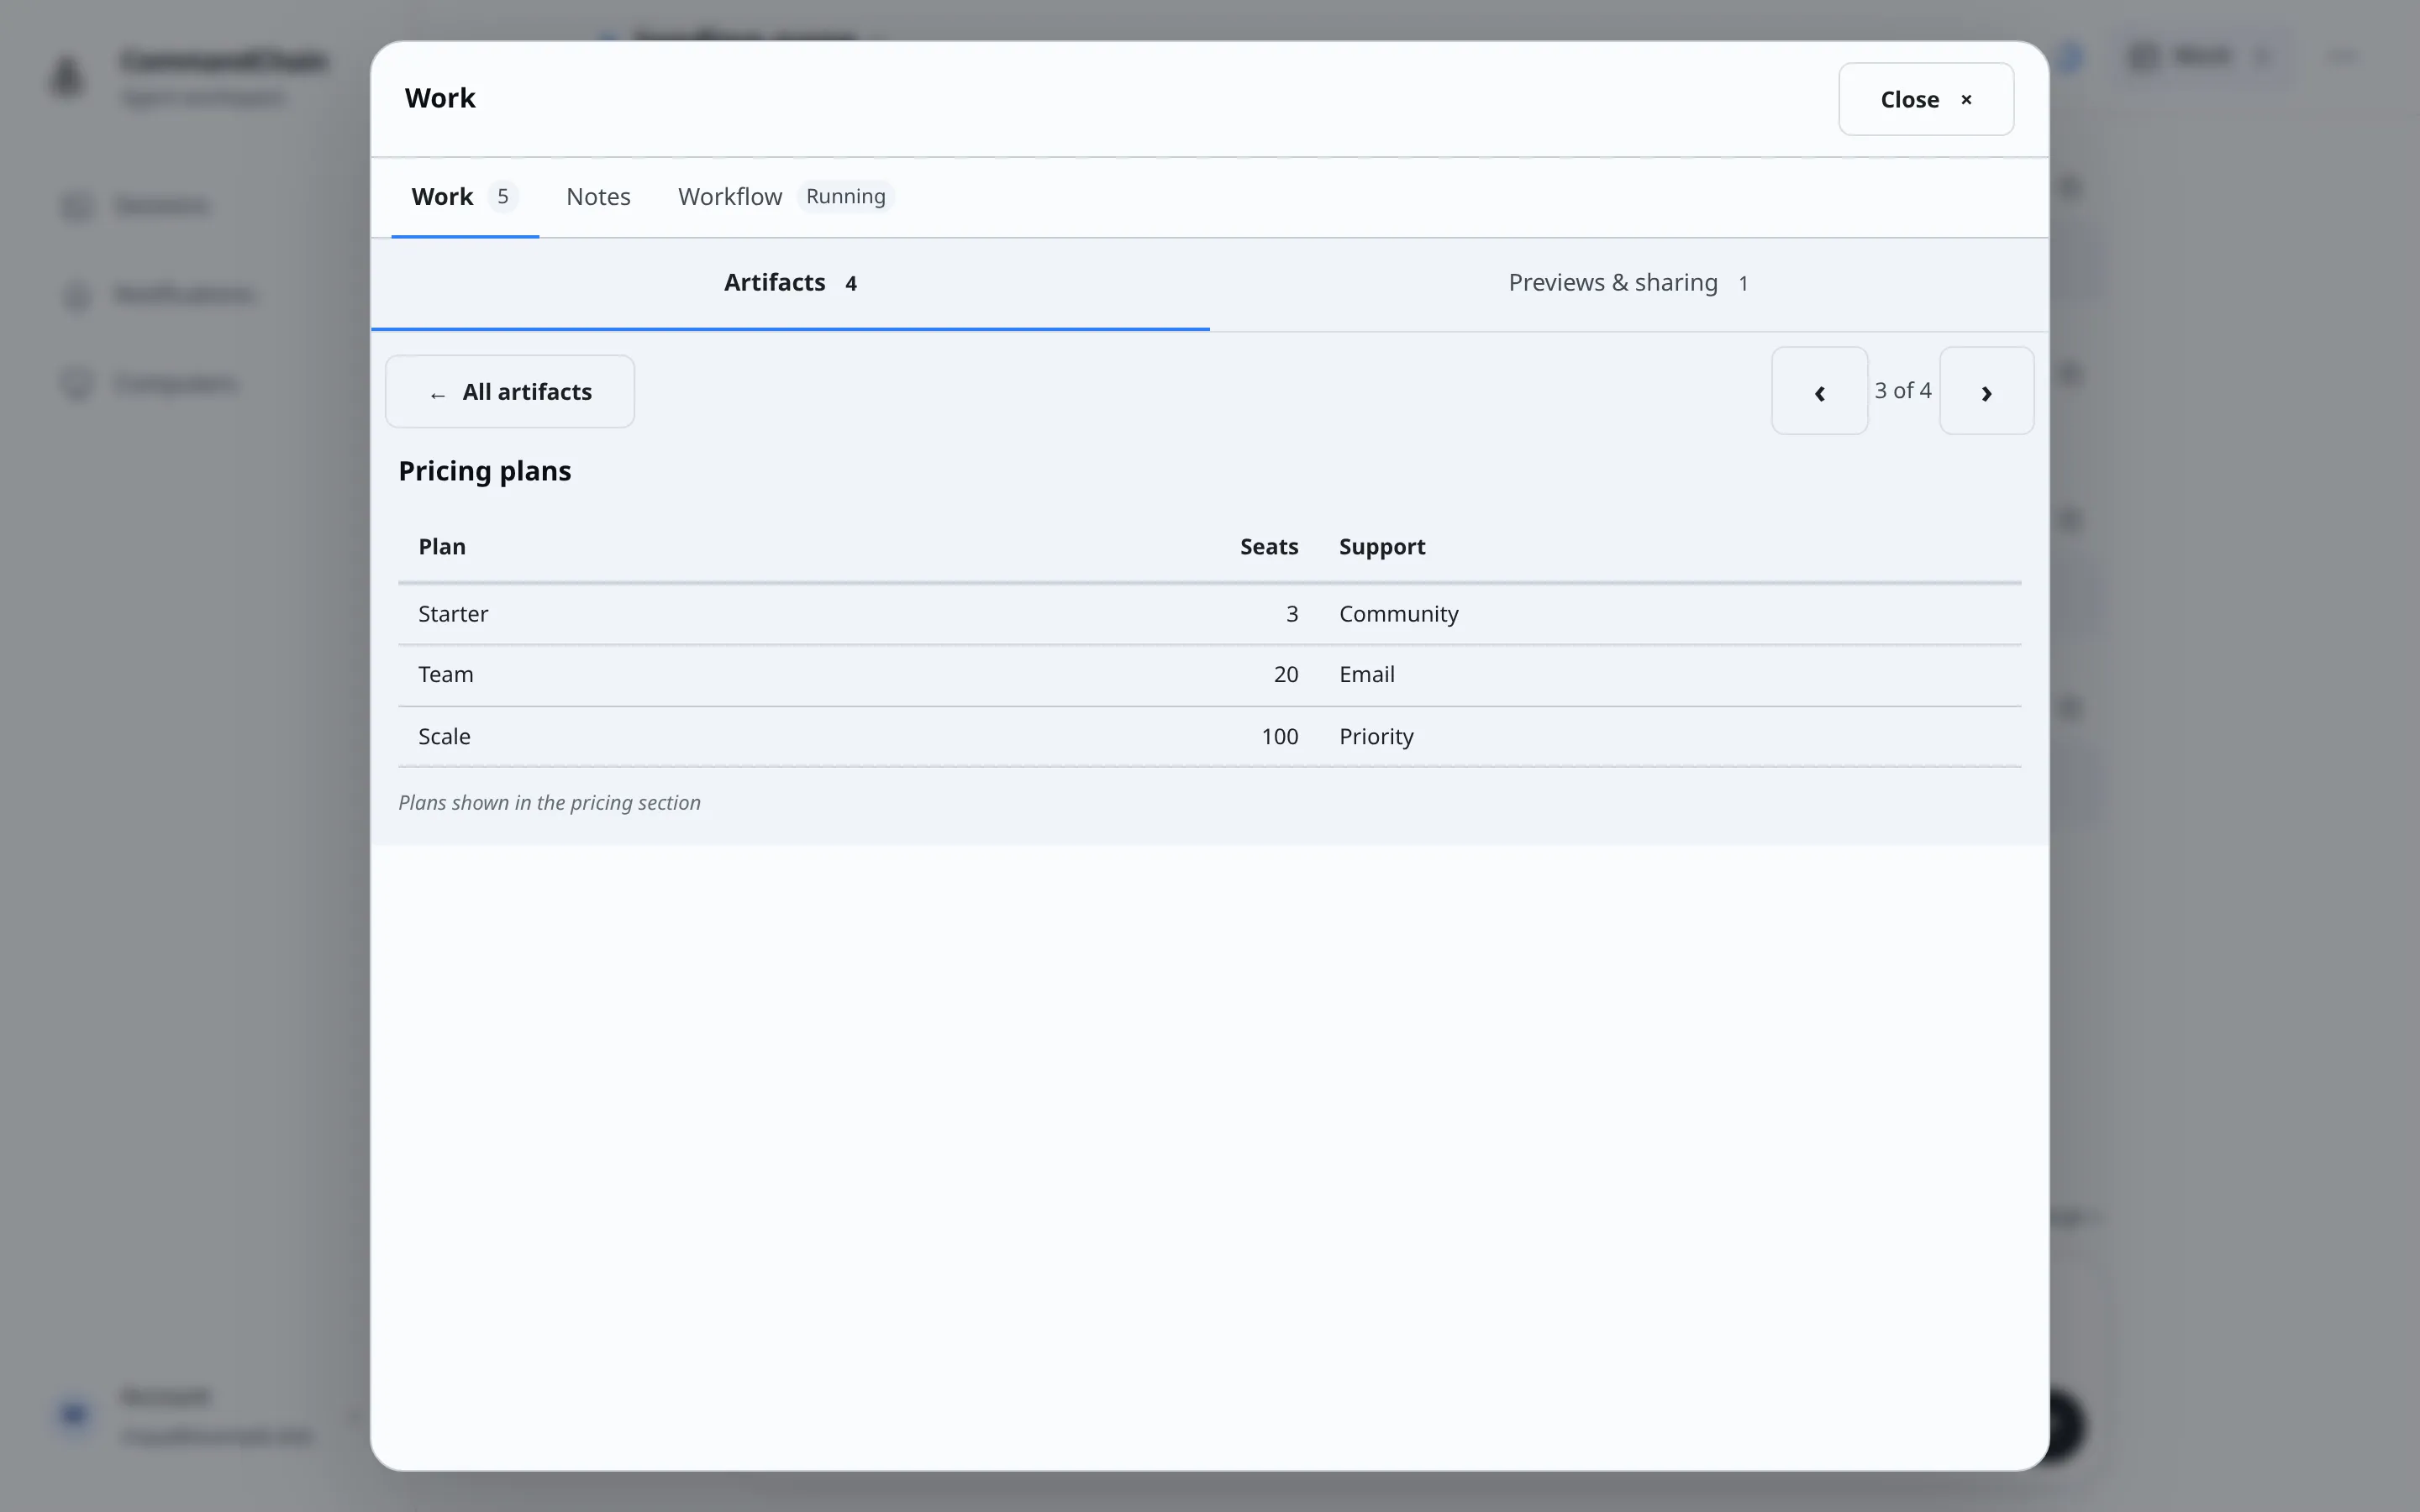
To get an artifact, ask for one in the conversation, for example “Draw a diagram of the checkout flow and publish it.”
To change an artifact, ask the agent for the changes, for example “Drop the third option from that table.” The agent replaces the artifact with the new version, so the gallery never fills up with old drafts. The updated artifact moves to the end of the gallery, and you get an Updated their work notification. Earlier versions aren’t kept. If you want to keep one, ask the agent to publish the new version as a separate artifact.
Follow a live dashboard
Section titled “Follow a live dashboard”Ask the agent to create a dashboard, for example “Create a live dashboard for these GitHub issues. Show overall progress, each issue’s status, a donut chart by status, and screenshots as you finish each fix.”
Open the dashboard from Artifacts, or pin it to return to it from the session header. Updates appear while it is open. The agent designs its layout once, then updates the underlying data without rebuilding it.
Dashboards can contain summaries, metrics, progress, status lists, tables, activity feeds, image galleries, embedded artifacts, and line, bar and donut charts. Choose View data below a chart to see exact values. Embedded artifacts follow the latest version published in this session.
On a phone, wide tables scroll sideways to keep their columns readable. A hint below the table tells you when more columns are offscreen. This also applies to embedded tables and chart data.
The dashboard shows when its data was last updated and whether the agent is working, ready, stopped or offline. Data updates come from the agent; the dashboard does not independently poll GitHub or other services after the agent stops. Its most recent data stays available.
When you return to a dashboard, highlighted values show what changed since your last visit. Each affected section shows a change count, added rows say New, and removed rows are counted above the section. Changed chart values appear in the expanded data table. Highlights stay visible during your visit, including when more updates arrive, and clear when you close and reopen the dashboard.
Your first visit establishes the comparison. Visit history is saved for your account in this browser for the ten most recently viewed dashboards. A different browser, cleared browser storage, or unavailable browser storage starts a new comparison. The markers show differences from the last data you viewed, rather than every intermediate update.
Creating a dashboard notifies you. Ongoing updates refresh quietly, including the updated indicator on its pin. An agent can notify you separately when a milestone or blocker needs your attention.
Dashboard activity timestamps accept ISO 8601 dates with UTC (Z) or an explicit time-zone offset, such as 2026-11-01T21:55:00-05:00. If a terminal Claude tool call contains invalid data, the validation response identifies the field to correct before retrying.
View an image full screen
Section titled “View an image full screen”Choose an image to open it full screen. Pinch or double-tap to zoom in, and drag to move around a zoomed image. Swiping changes the image only when it fits the screen, so zooming never flips to the next one. Zoom in and Fit to screen do the same from the toolbar, and on a keyboard +, - and the arrow keys zoom and move. Close stays at the top of the screen; if you opened the image from the Work tab, it takes you back there.
Pin an artifact
Section titled “Pin an artifact”Pin the artifacts you return to so they sit in the session header, next to the repository status.
- Open the artifact and choose Pin.
- Pick a marker. Each marker has its own shape and colour, so you can tell your pins apart.
Choose a marker in the header to open that artifact. When the agent updates a pinned artifact, its marker leads to the newest version and shows a dot until you open it. Pins follow you to every device you sign in on.
To change the marker or unpin, open the artifact and choose Pinned. You can pin up to 12 artifacts in a session. If the agent removes a pinned artifact, its marker fades; choose it, then Unpin.
With no artifacts yet, the tab shows Your work will appear here and Write a message to jump back to the composer.
Previews
Section titled “Previews”A preview shows your app running on your computer, from a port the agent opens. Each preview lasts 4 hours from when the agent opens it. After that, its links stop working; ask the agent to open a new preview. Ask the agent to start your app and publish a preview, for example “Start the dev server and open a preview of port 5173.”
On the Free plan, 1 preview can be open at a time. See Plans and billing.
Each preview shows its title and Open preview in a new tab.
- An HTTPS preview also shows inline, in the panel.
- A local HTTP preview opens only in a new tab. The panel says Open this local preview in a new tab. Browser cookie rules prevent embedding local HTTP previews.
Other states you may see:
- Starting preview on your computer…
- This preview is offline. Ask the agent to restart the app.
- The preview link is unavailable. Refresh the session or ask the agent to publish it again.
With no previews yet, the tab shows Preview your running app.
Share a preview
Section titled “Share a preview”Sharing is off until you turn it on for a preview.
- Choose Share preview. You see: Anyone with the link can view this app. Check that the preview contains only what you want to share.
- Choose Create share link, or Keep private to back out.
- The link appears in Shared preview link. Choose Copy link to copy it.
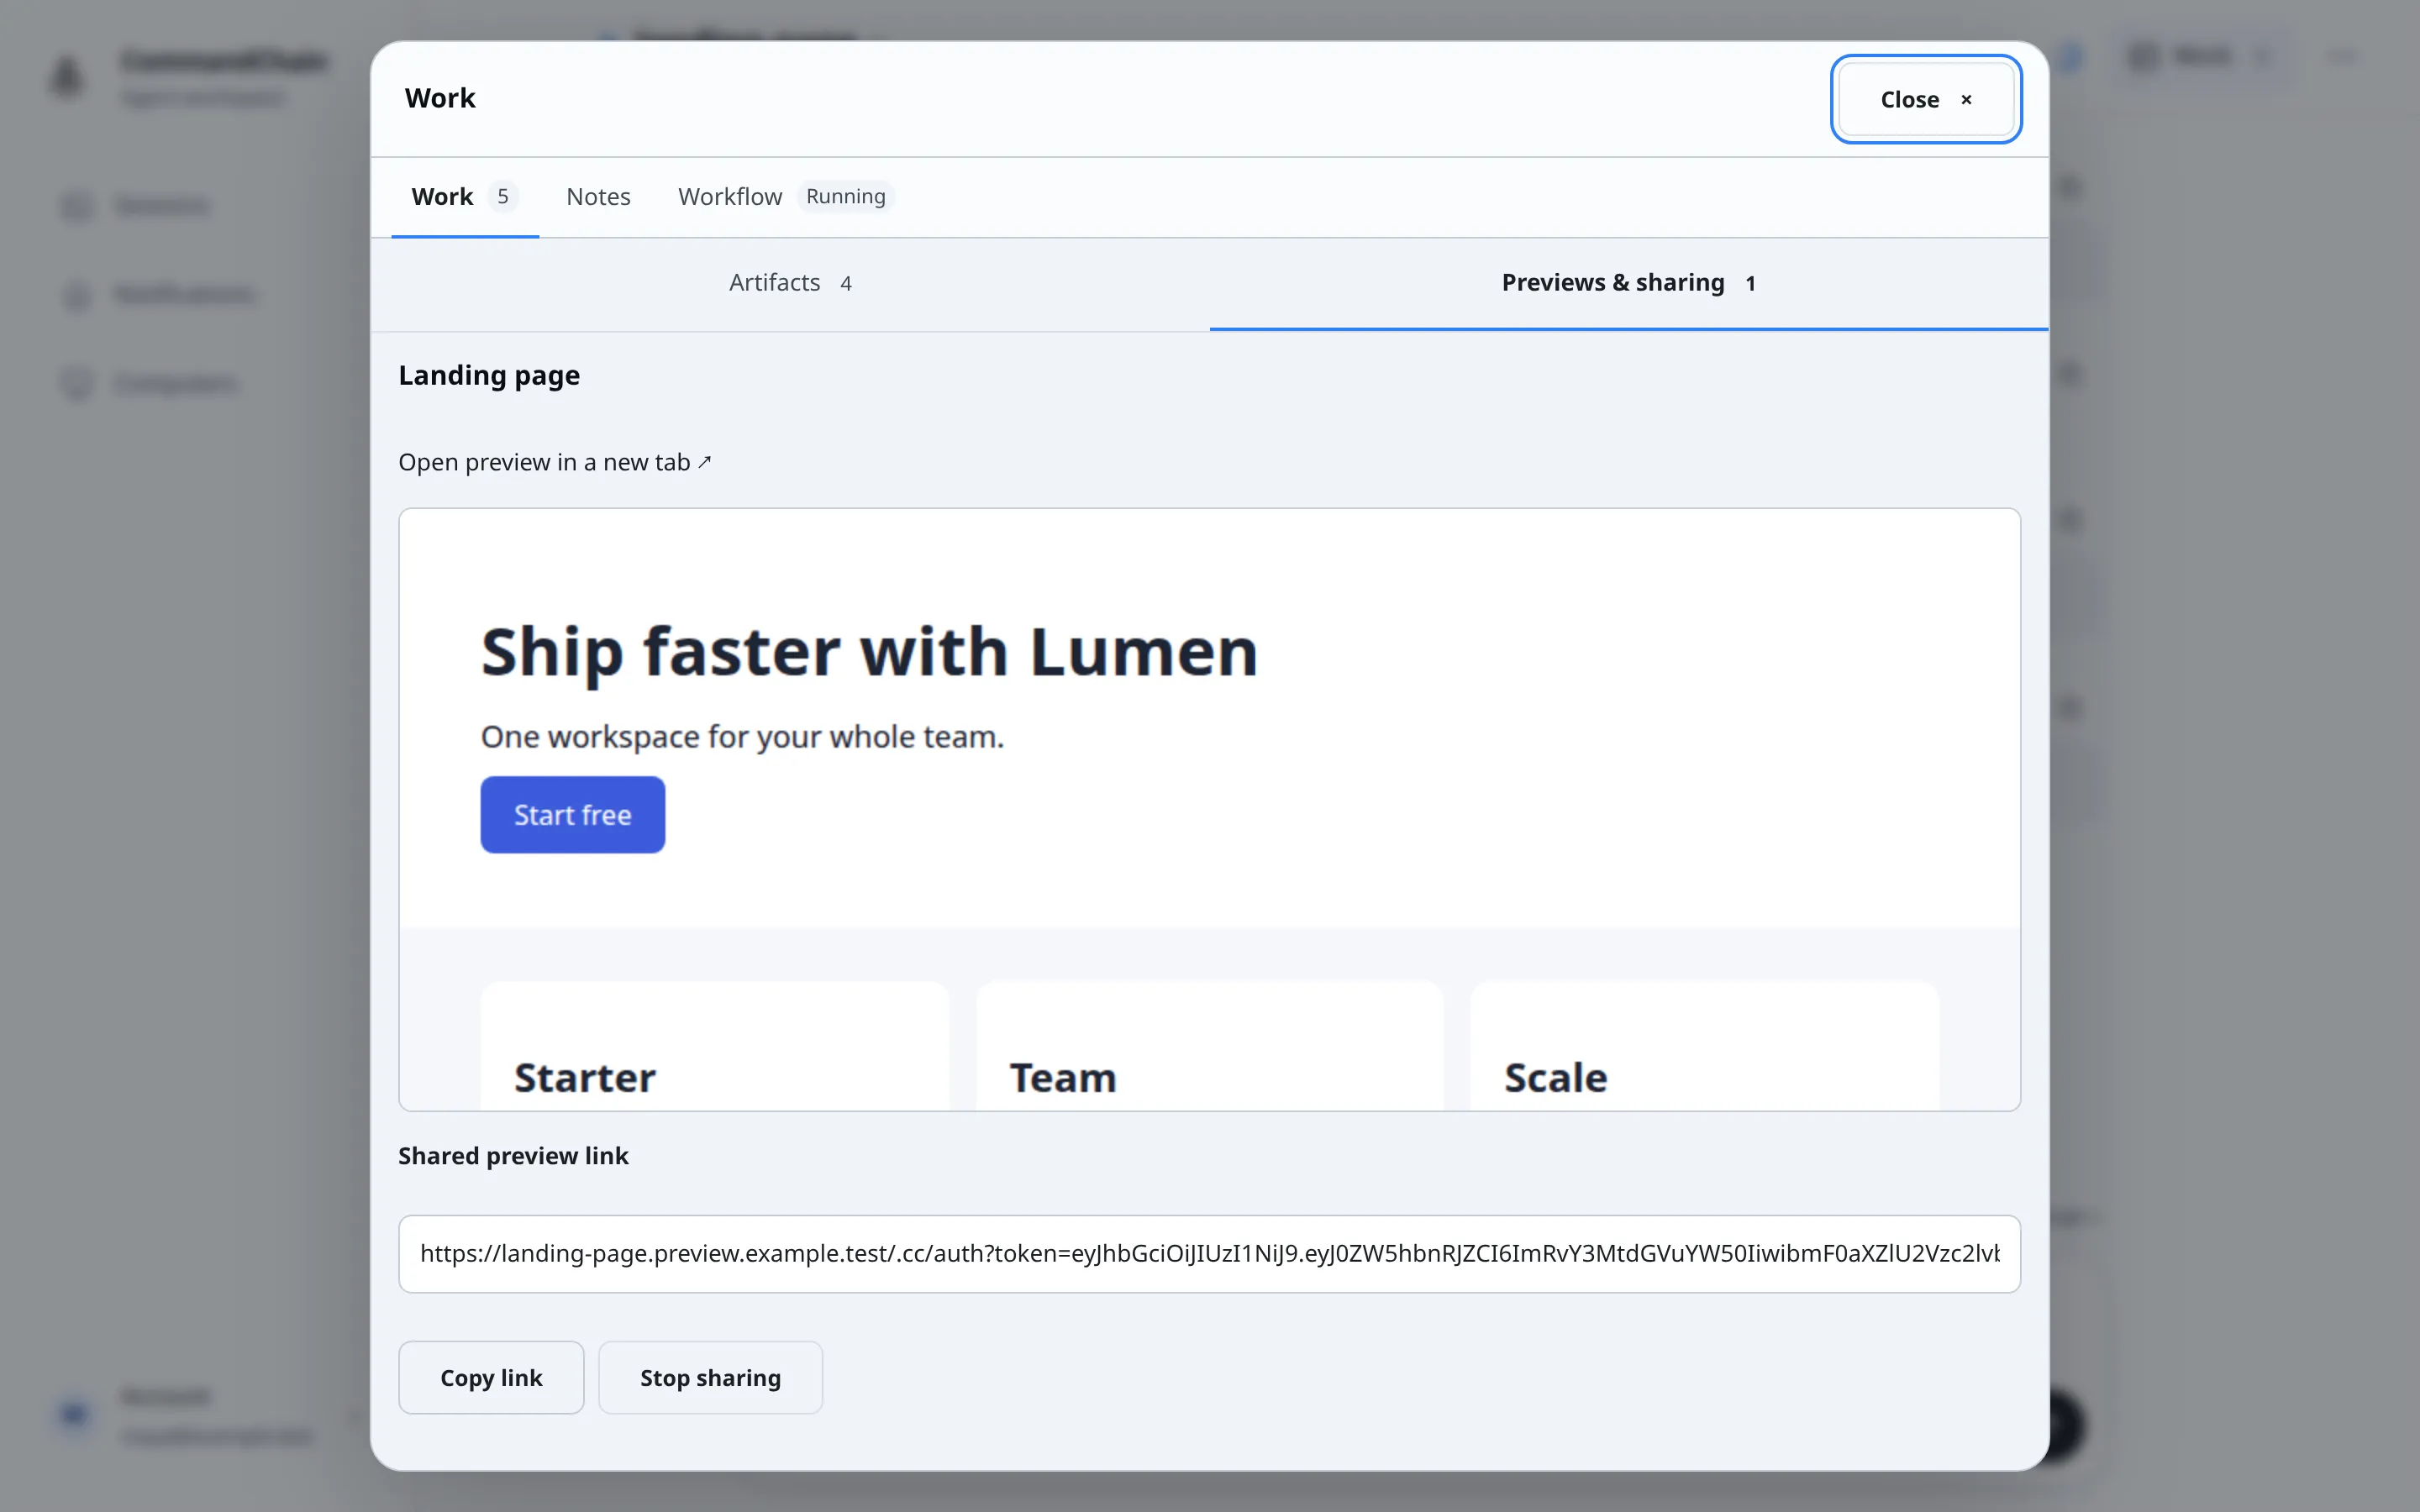
Anyone with the link can view the preview while sharing is on, the app is running and the preview has not expired. They do not need a CommandChain account. When the preview expires after 4 hours, shared links stop working too, and trying to share it shows This preview has expired. Ask the agent to open a new preview.
Choose Stop sharing to turn it off. Every link you shared for that preview stops working. If you share it again later, you get a new link.